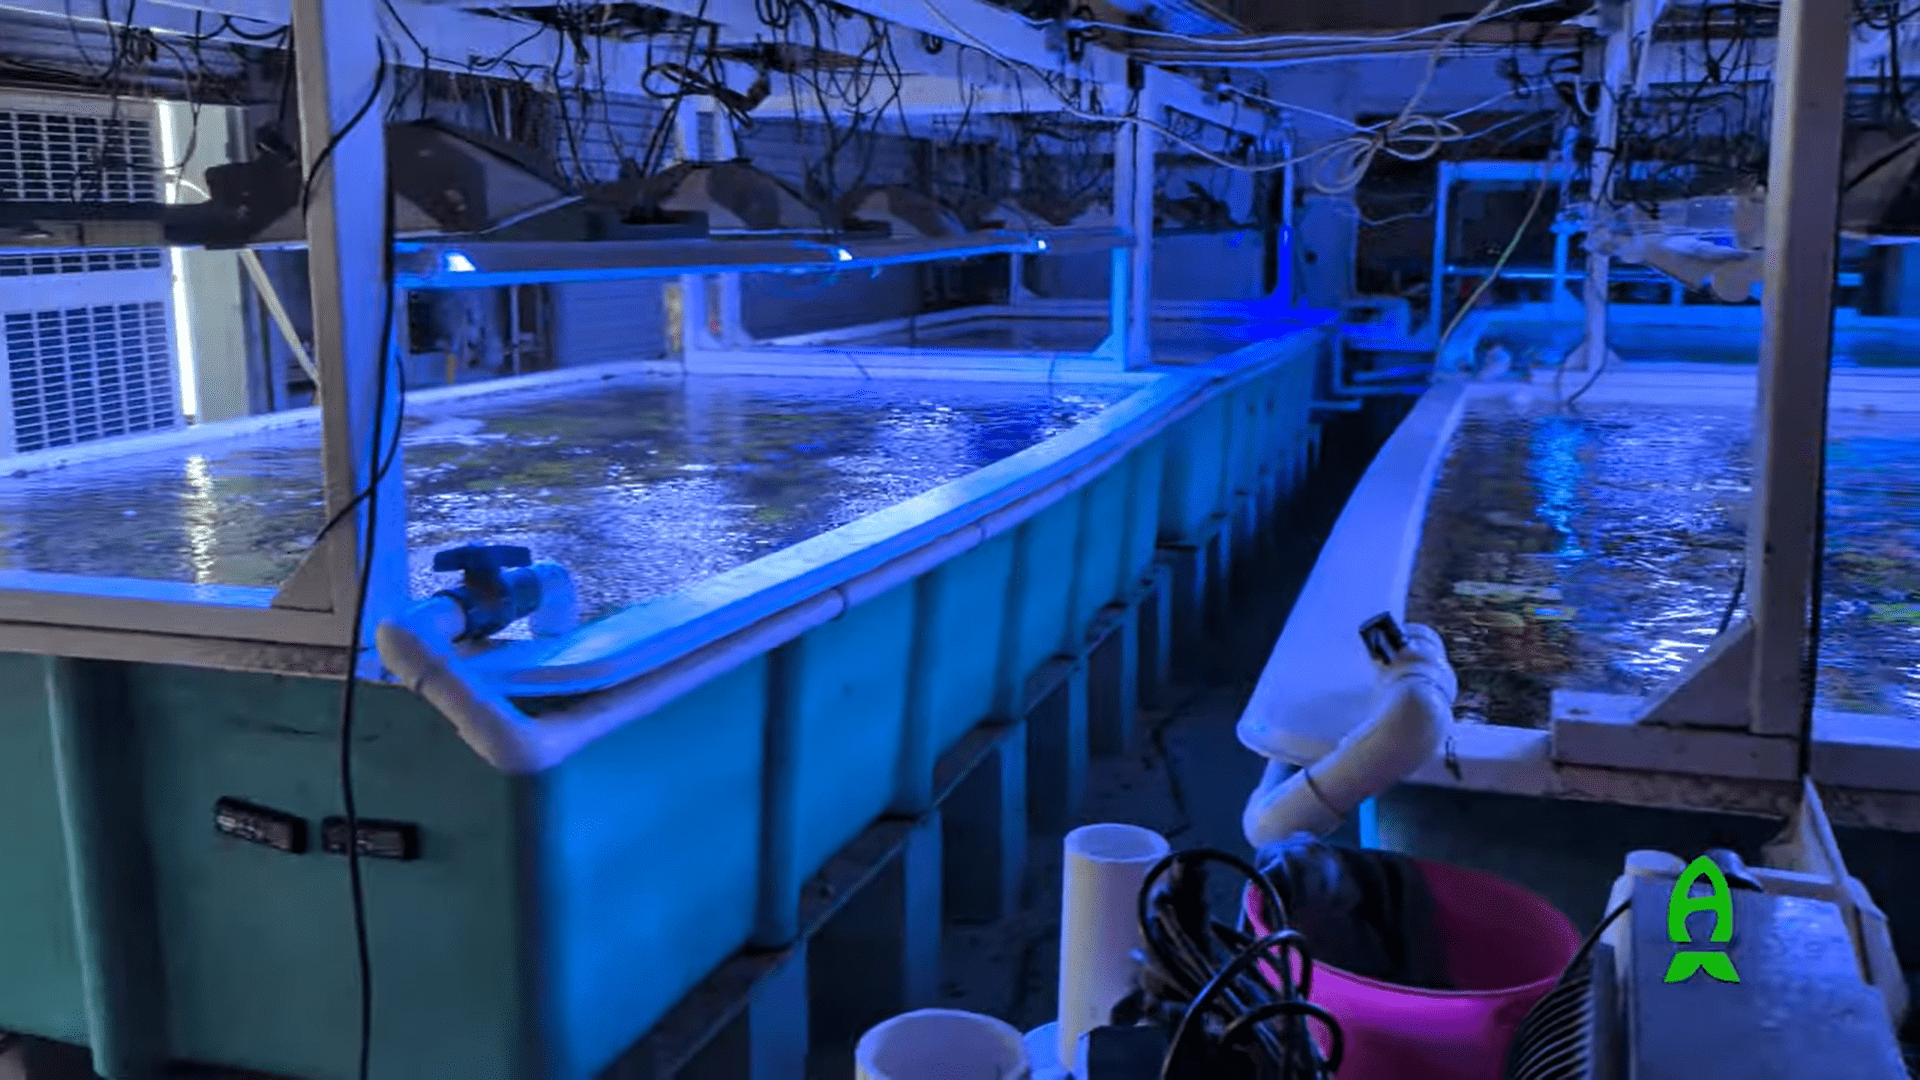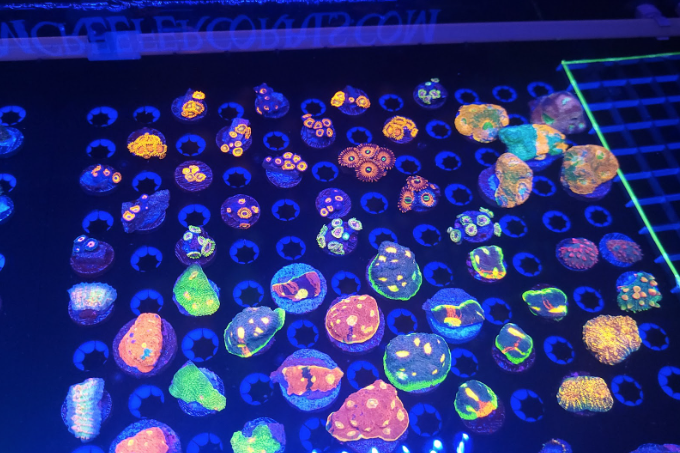
Last week, I went to Saint Louis (Remy’s stomping grounds) to make content and speak at the Reefing USA coral show. Before coming, Remy had the great idea of testing all the vendor’s systems at the show to analyze potential differences in water chemistry. After many hours of testing, we have done just that. This article will summarize our results from testing each system’s salinity, phosphates, and alkalinity at the show. We wanted to determine the average range of these essential parameters to help people better understand how to acclimate the corals they get from a swap.
Materials and Methods
In total, we sampled 14 vendors, but we had 15 data points. One vendor had two systems – one contained an assortment of rock flower anemones, and the water was visually milky, so we decided to sample this system to determine if there was a chemical difference between the baseline system and the one with the anemones. These two systems are represented as “vendor I” and “vendor I (nem)” in the data.
A zip lock baggie from each vendor was collected. All samples were collected in a window from 10:05 to 10:32 am (27 minutes). After sample collection, all samples were stored in an on-site fridge to prevent biological activity from changing the values. After the show, the samples were transferred to Remy’s home, where we determined we were tired. We left the samples out for three days at room temperature and tested sporadically during this period. This ruined any controls for potential biologics shifting concentrations; thus, this could have affected the accuracy of our results.
The alkalinity and phosphate tests were conducted with Hannah alkalinity and ultra-low phosphate testers. Each cuvette was rinsed with RO water between each use. Salinity was measured with a BRS refractometer and Brightwell calibration solution. The refractometer was cleaned and calibrated between each test.
While we could have gotten more accurate results with higher-grade testing methods, we chose to use common testing apparatus available to the hobby to demonstrate that with the correct techniques and data analysis, others could conduct small studies at home using hobby-grade equipment to at least generate some potentially useful data.
In the future, we plan to conduct similar studies and get more precise results by utilizing tools such as tabletop vortexes to mix the sample as opposed to mixing via manual inverting/shaking. Another example of human error was not getting all the reagents in the cuvette. The most significant known discrepancy this caused was vendor E’s alkalinity. The second alkalinity test was low compared to the other two trials – this likely affected the p-value to a small extent in the single-factor ANOVA.
Typically, good practice would be to repeat this test, but a week in STL and dozens of alk tests in a row lead to some apprehension. Thus, another good investment would be custom 3d printed funnels designed for the Hannah cuvettes and more liquid motivation (Redbull), increasing the incentive to redo the poorly executed tests. We also hope to collect a specific volume from each vendor and to process all of the samples within 24 hours while storing samples that have yet to be processed in a fridge.
Results
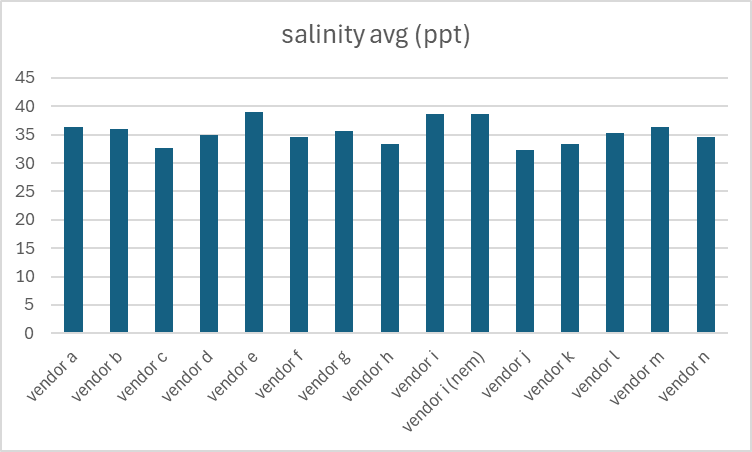
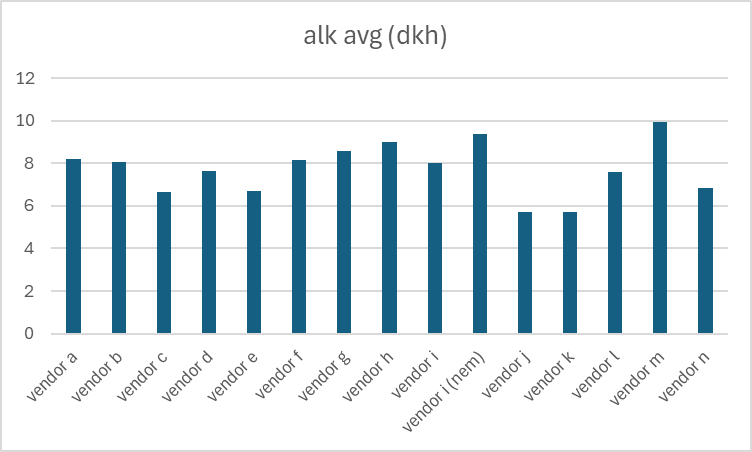
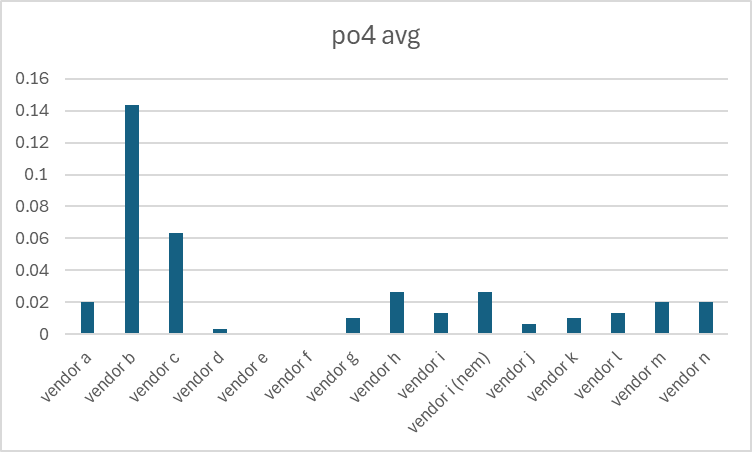
Below, you can see the results for each core parameter among vendors. The cells highlighted in purple represent the averages of each vendor.
The high for salinity was 39.0 ppt, while the low was 32.3 ppt. The high for alk was 9.3 dKH, while the low was 5.7 dKH. The high for po4 was 0.14 ppm, while the low was 0 ppm
Thus, the total range in values was:
– Salinity (ppt) = 7.0
– Alkalinity (dKH) = 5.35
– Po4 (ppm) = 0.15
The following graphs show the distribution of averages for each vendor.
I decided to be extra and conduct an ANOVA single-factor test for each parameter to confirm the results from each vendor were statistically different. The results for each ANOVA test are below.
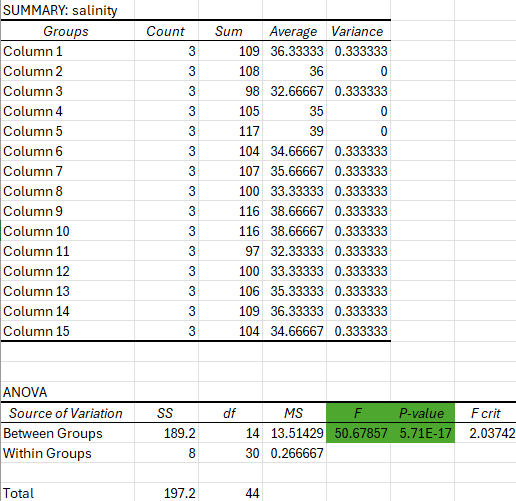
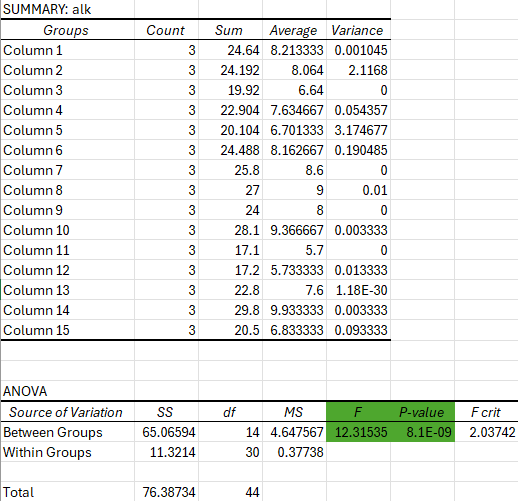
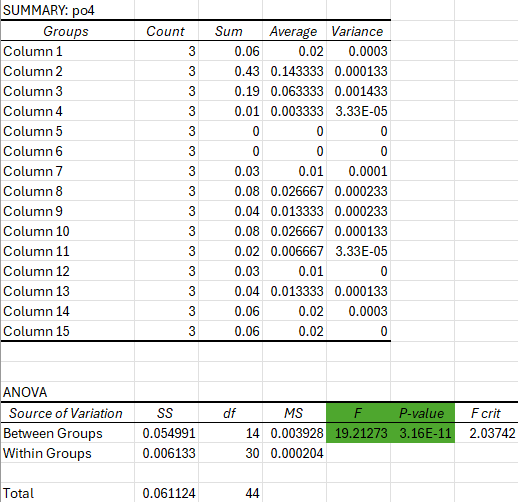
Assuming the standard p-value of 0.05, each of the determined p-values is far below this threshold, which confirms that each of the vendors has statistically different parameters.
Discussion
This intention was not to bash any vendors for their specific parameters, as many factors are involved in traveling to shows that can lead to many uncontrollable shifts. Instead, we hoped to promote the idea of asking what parameters the vendors keep their corals at and also help educate consumers on correctly processing their new corals after a swap.
Based on the data from this show, we can see a relatively broad range of core parameters. Adding corals from a vendor system with a salinity of 32 ppt or 38 ppt if you run your system at 35 ppt could cause excess stress to the coral or even lead to death, depending on the preexisting health of the coral. While I typically never recommend people do this based on the data generated, it may be a good idea to drip acclimate any corals you get at a frag swap to avoid a fast and potentially significant swing. An alternative approach would be to test the bag water of the corals to determine if temperature or drip acclimating would be a better strategy. Of course, another good practice with all new frags is quarantine to ensure no pest microbial or macroscopic enter a display system.
In the future, we hope to have tighter controls and repeat this experiment. Another angle we wish to pursue is to take samples from all vendors at a swap and send them off for ICP and Aquabiomics analysis. This will help determine if trace contamination or coral pathogens are common at shows, which could also help create new best practices post-swap.
Acknowledgments
Shout out to Remy for doing much of the testing associated with this experiment. In the future, we hope to have more manpower and test kits to efficiently complete the copious amounts of testing required to generate data such as this. Thank you to all of the coral vendors for willingly providing water samples. Thank you to Reefing USA for putting on the show and buying us pizza. Thank you to Sanjay Joshi and Richard Ross for explaining an ANOVA test in their ICP analysis article here, so I don’t have to retype the explanation in this article.
And finally thank you to Raj for purchasing all of the new reagents needed to perform these tests and for paying for my college tuition.